Visualize Legal Data on Demand in Harvey
Jun 18, 2026
Summary
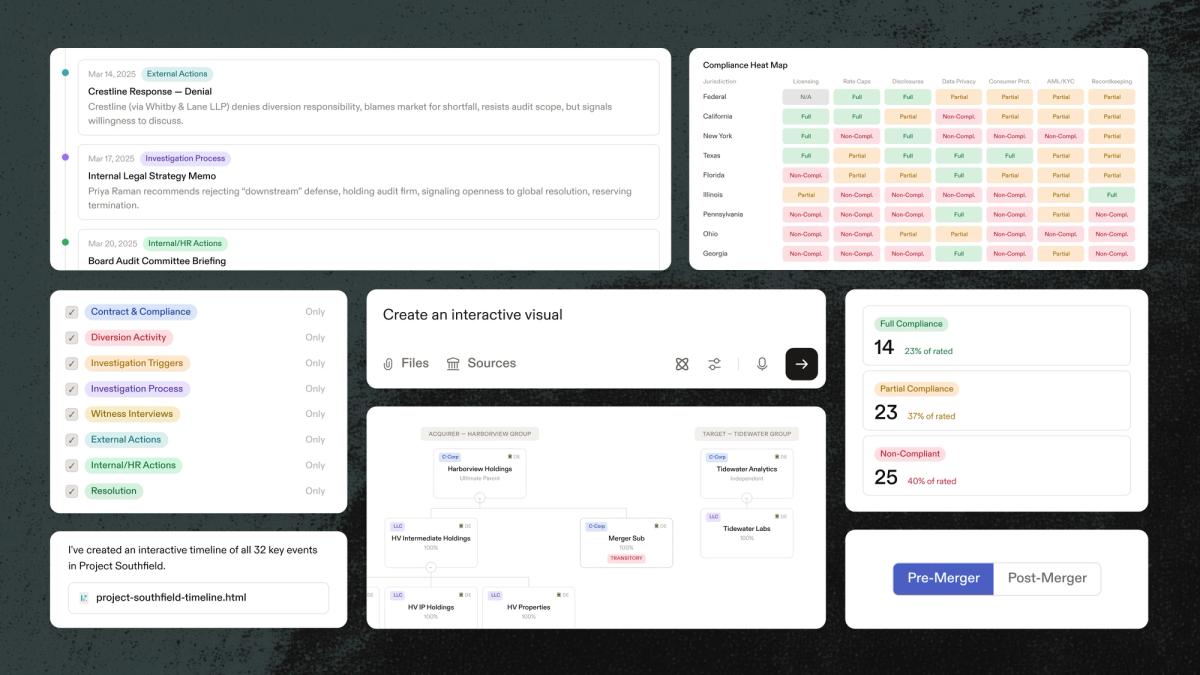
This post details the expansion of Harvey's Legal Data Visualization capability to include interactive timelines, entity charts, compliance matrices, and dashboards. It highlights five specific use cases: mapping pre- and post-closing corporate structures in M&A, surfacing relationships between key witnesses and entities, creating investigation timelines from case materials, visualizing financial flows in investigations, and building compliance dashboards across jurisdictions. All interactive outputs can be downloaded as shareable .html files.