
Visualize Team Usage With Sophisticated Usage Dashboard
Feb 23, 2021
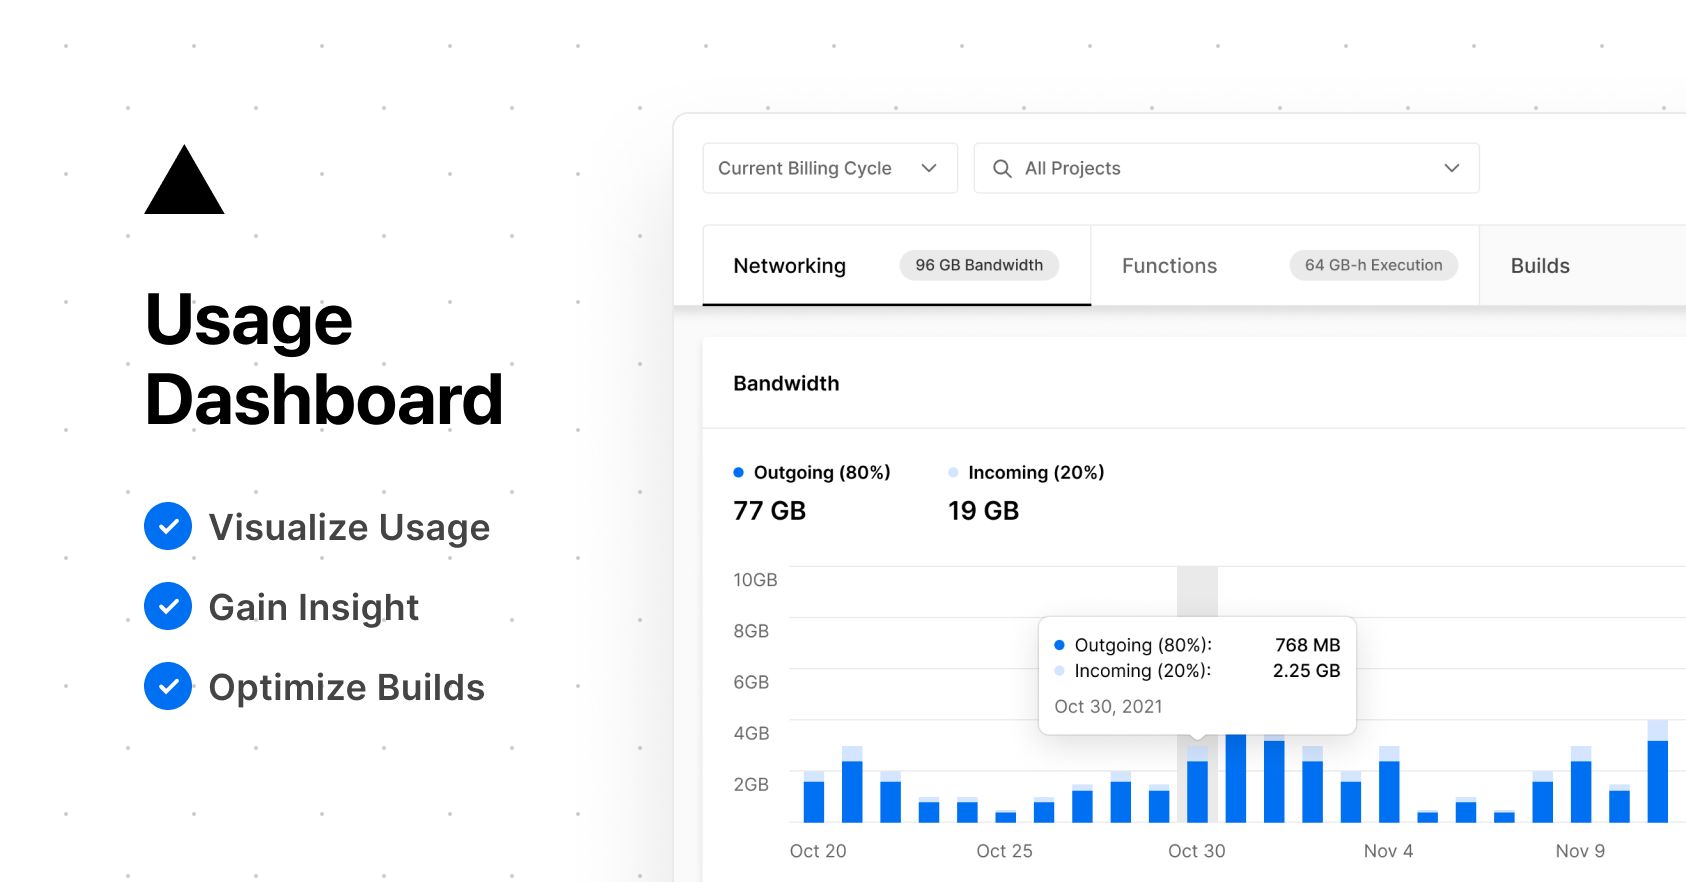
Summary
Introduced a dedicated Usage overview dashboard for Pro and Enterprise plans, visualizing resource usage for Teams across Networking (Bandwidth, Requests), Functions (Invocations, Executions, Errors, Timeouts, Throttled), and Builds (Queued, Build Time, Number of Builds). This replaces manual CSV downloads and provides automated insights and actionable recommendations within each section.