An all-new, interactive visualization experience for Hex
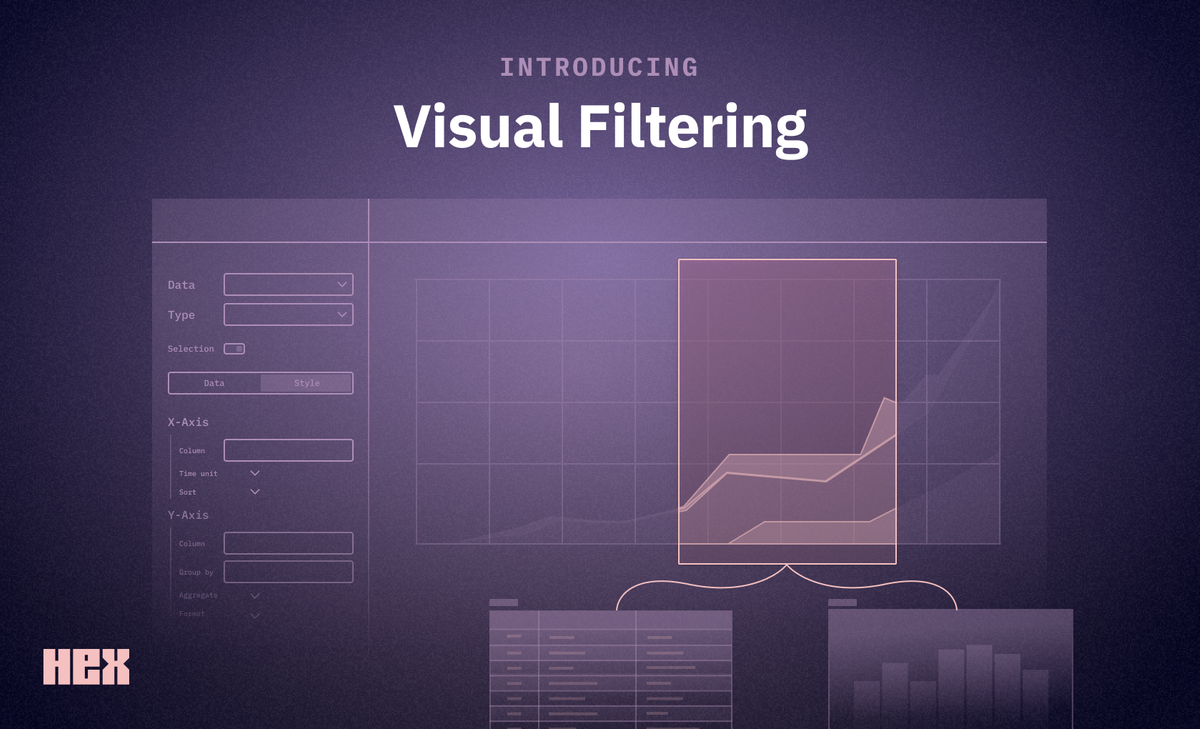
This post introduces an all-new, interactive visualization experience for Hex, featuring point-and-click visual filtering, a completely rebuilt chart cell UI with more intuitive controls and sensible defaults, and custom color palettes for on-brand charts. It highlights that the new experience is powered by the Vega ecosystem, specifically Vega-Lite for building blocks and VegaFusion for server-side acceleration to handle large datasets. The interactive visual filtering allows users to select data points directly from charts to create filtered result sets, which can then be used downstream in tables or other visualizations. The new editor UI simplifies chart creation with fewer clicks and finer-grained styling options. Custom color palettes can be configured by admins to ensure charts are on-brand by default.