New CPU Usage tool in the Performance and Diagnostics hub in Visual Studio 2013
Feb 28, 2014Dan Taylor
Summary
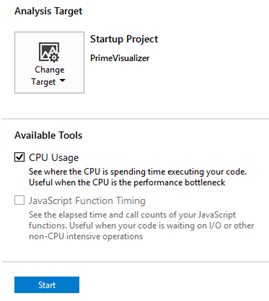
Introduces the new CPU Usage tool within the Visual Studio 2013 Update 2 Performance and Diagnostics hub. This tool provides low-overhead statistical sampling to measure CPU time spent executing C++, C#/VB, and JavaScript code. It offers detailed reports with 'Total CPU' and 'Self CPU' metrics (both percentage and milliseconds) to identify performance bottlenecks. The post demonstrates its use with a sample application, showing how to analyze CPU-intensive functions like 'BruteForceNextPrime' and how to iterate on optimizations using improved algorithms and parallelization, measuring the impact on both elapsed time and CPU time.