Profile Your CPU in the Debugger in Visual Studio 2015
Oct 29, 2015Nikhil Joglekar
Summary
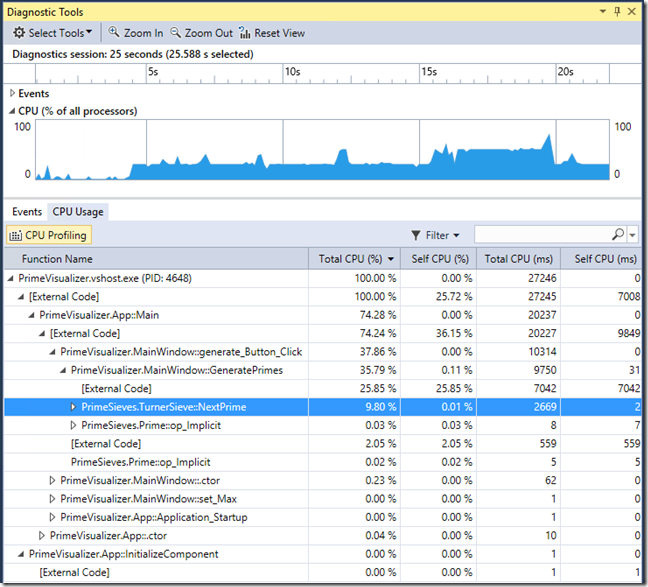
This post details the updates to the CPU Usage tool in Visual Studio 2015 Update 1, enabling full CPU profiling without stopping a debug session. It introduces the CPU Usage tab within the Diagnostic Tools window, allowing users to toggle profiling on/off, view CPU utilization graphs, and examine a call tree breakdown of CPU usage in a break state. The post explains the data collection method (sampling), the overhead introduced by debugging, and suggests running in Release Mode for more accurate profiles. It also notes project compatibility limitations.