Performance Profiling on Windows Phone 8.1 with Visual Studio
Apr 3, 2014Haseeb Ah
Summary
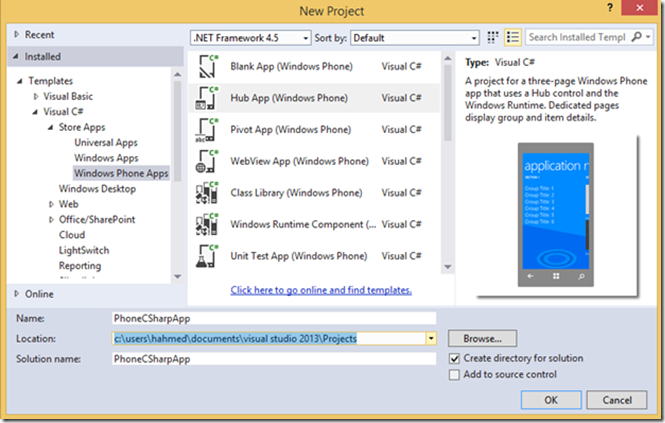
This post details the process of performance profiling Windows Phone 8.1 XAML and JavaScript apps using Visual Studio's Performance and Diagnostics hub. It covers creating a sample app, configuring profiling settings (Target, Mode, Architecture) for a physical device, selecting tools like CPU Usage and XAML UI Responsiveness, and interpreting the resulting performance reports. It also notes that Silverlight Phone apps require the use of separate, older profiling tools.