
Curve fitting for charts: better visualizations for Vercel Analytics
Sep 9, 2022
Summary
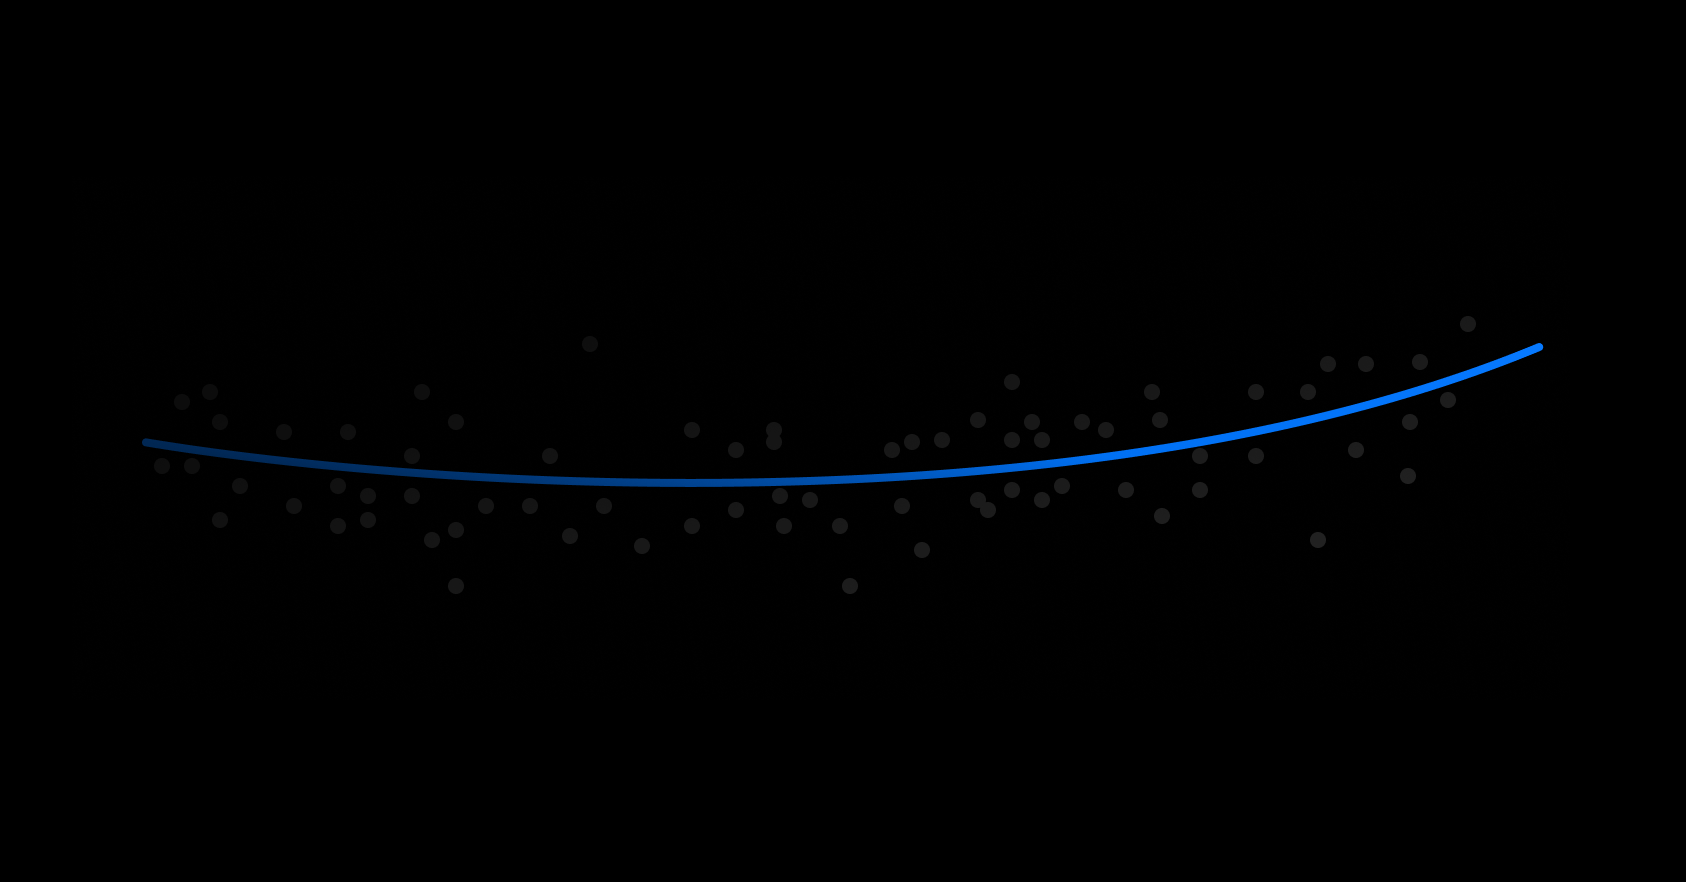
Introduced curve fitting (specifically polynomial regression) to Vercel Analytics charts to improve trend visualization and delta calculation. This addresses the issue of noisy data points obscuring trends and inaccurate delta measurements based solely on first and last points. The implementation involves selecting an optimal polynomial order by balancing Mean Squared Error (MSE) on training and test datasets to avoid overfitting.