Application Insights - Metric Explorer (ME) – Part 2
Dec 15, 2014Importer
Summary
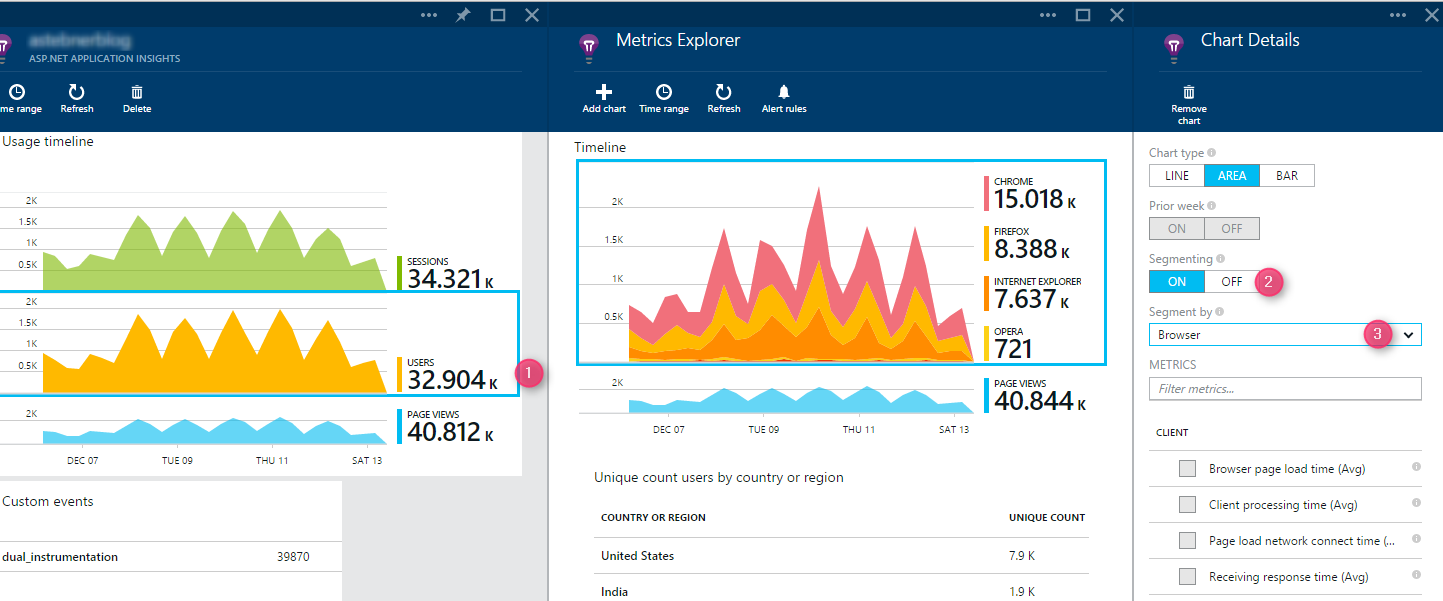
This post details the segmentation capabilities within the Metrics Explorer, allowing users to slice and dice telemetry data by various dimensions such as browser, device, and screen resolution to gain deeper insights into user behavior and application performance. It also covers setting up server performance metrics like request duration, dependency duration, and processor time, and correlating them with specific requests or dependencies.
More from the Application Insights Deployment Markers trail
- Issue with using Application Insights with load tests
- Monitor Team Services web extensions with Visual Studio Application Insights
- Getting Application Insights counters with Cloud-based Load Testing
- Application Insights: Choose your own Performance Counters
- Introducing the Application Insights SDK for Java