Application Insights - Metric Explorer - Part 1
Nov 3, 2014Ketan Ghelani [MSFT]
Summary
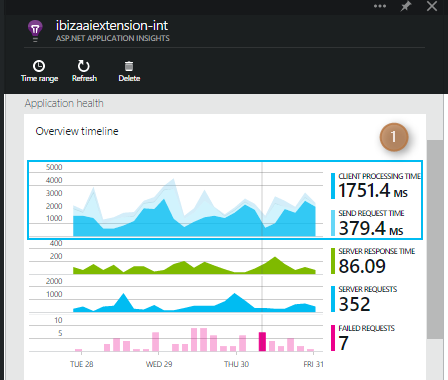
This post introduces the Metrics Explorer (ME) in Application Insights, detailing its functionality for analyzing client performance metrics. It explains how to drill down from the overview page to ME, which displays charts and grids for metrics like average browser page load time by base URL and browser exceptions by file name. The post also breaks down client timing metrics according to W3C navigation timing steps and explains how to customize charts by selecting different metrics and chart types. It categorizes metrics into Client, Failures, Performance counters, Server, and Usage, and explains why some metrics may appear greyed out due to scale and aggregation type compatibility.
More from the Application Insights Deployment Markers trail
- Issue with using Application Insights with load tests
- Monitor Team Services web extensions with Visual Studio Application Insights
- Getting Application Insights counters with Cloud-based Load Testing
- Application Insights: Choose your own Performance Counters
- Introducing the Application Insights SDK for Java