Case study: Application Performance Monitoring with Application Insights
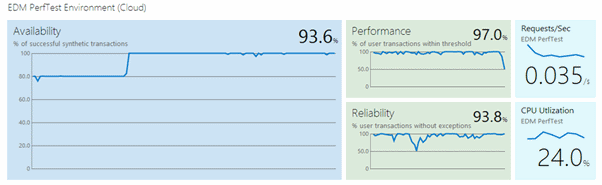
This post details how to set up availability monitors, performance monitoring, and dashboards for live sites using Application Insights. It provides specific guidance on configuring availability tests, including testing for strings and backend connections, and setting up alerts for dips in reliability. The post also explains how to use Application Insights for pre-production monitoring by adjusting configuration parameters like DisplayName, PerformanceThreshold, and Sensitivity to gain more detailed insights. A significant contribution is the detailed walkthrough of diagnosing a performance issue by analyzing response times, resource calls (specifically WCF services), and exceptions, leading to the identification of a cross-continent database connection as the root cause and the solution of hosting services in the same data cluster using affinity groups.
More from the Application Insights Deployment Markers trail
- Issue with using Application Insights with load tests
- Monitor Team Services web extensions with Visual Studio Application Insights
- Getting Application Insights counters with Cloud-based Load Testing
- Application Insights: Choose your own Performance Counters
- Introducing the Application Insights SDK for Java