Enhancements to Debugging Exceptions with IntelliTrace in Visual Studio 2013
Mar 7, 2014Nitin Choubey
Summary
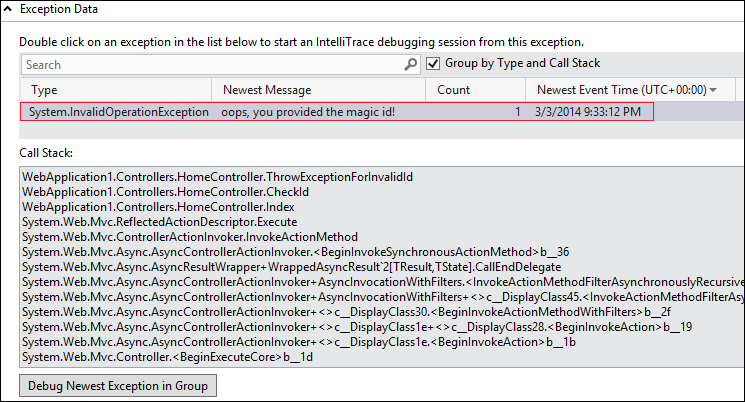
This post introduces enhancements to IntelliTrace in Visual Studio 2013 Update 2, specifically focusing on exception debugging. It details how IntelliTrace now integrates with Code Map and CodeLens to display the call stack leading to an exception, along with the exception message. A key improvement is the ability to view method parameters directly within a CodeLens popup window without needing to navigate to the locals window, streamlining the debugging process. The post also covers navigating to source code and managing the Code Map window.
More from the IntelliTrace Stand-Alone Collector Configuration trail
- Searching and filtering the Events tab of the Diagnostic Tools window
- IntelliTrace, method call information, and Edit and Continue
- Finding swallowed and async exceptions using IntelliTrace in VS2015
- Collect data from a windows service using the IntelliTrace Standalone Collector
- IntelliTrace in Visual Studio Enterprise 2015 now supports attach!