Exploring Data at Scale with New Capabilities in Application Insights and Metrics Explorer
Feb 19, 2015Andrew Bragdon [MSFT]
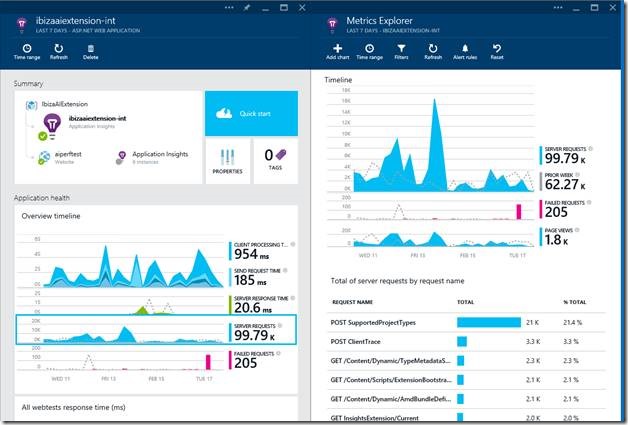
Summary
This post introduces new capabilities in Application Insights' Metrics Explorer for exploring large volumes of data and extracting key insights. Key features include: filtering data by properties like Country/Region and Browser; improved segmentation for breaking down metrics by dimensions; customizable grids for displaying data in tabular format with multi-metric support; and usability improvements such as hover-over time labels, info icons with metric descriptions, and comparison with the prior week's data. It also details how to add new charts, customize chart height, and create reports from scratch, including visualizing custom metrics.
More from the Application Insights Deployment Markers trail
- Issue with using Application Insights with load tests
- Monitor Team Services web extensions with Visual Studio Application Insights
- Getting Application Insights counters with Cloud-based Load Testing
- Application Insights: Choose your own Performance Counters
- Introducing the Application Insights SDK for Java