IntelliTrace in Visual Studio Ultimate 2015
Jan 16, 2015Angelos Petropoulos
Summary
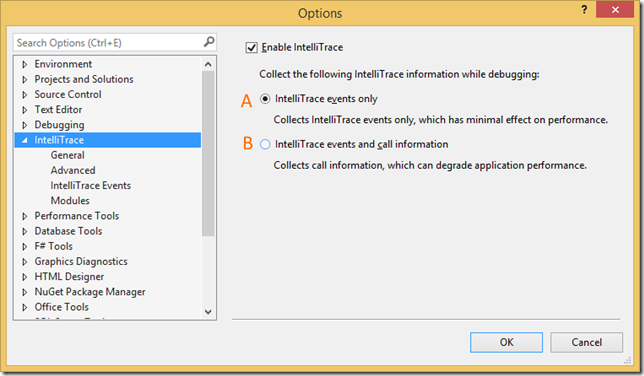
This post details the integration of IntelliTrace into the new Diagnostic Tools window in Visual Studio 2015 for live debugging. It breaks down the components of the Diagnostic Tools window, including the Events details table (with columns for Event, Time, Duration, and Thread) and the Events timeline (with Break Events and IntelliTrace Events tracks). It also outlines user actions like activating historical debugging, copying event details, filtering events by category and thread, and showing events from external code. The Diagnostic Tools toolbar is also described, with options for selecting tools and zooming the timeline.
More from the IntelliTrace Stand-Alone Collector Configuration trail
- Searching and filtering the Events tab of the Diagnostic Tools window
- IntelliTrace, method call information, and Edit and Continue
- Finding swallowed and async exceptions using IntelliTrace in VS2015
- Collect data from a windows service using the IntelliTrace Standalone Collector
- IntelliTrace in Visual Studio Enterprise 2015 now supports attach!