Optimizing IntelliTrace Collection on Production Server
May 18, 2012James Wang (MS)
Summary
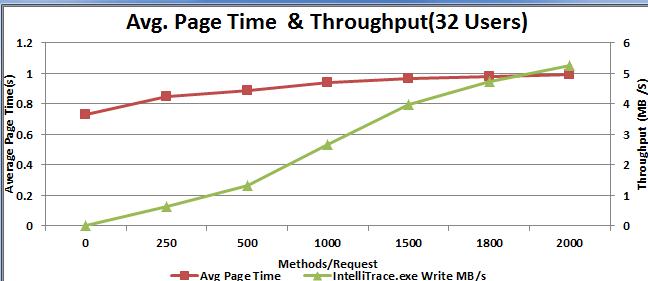
This post introduces the Visual Studio 11 standalone IntelliTrace package for production server collection. It details three instrumentation modes (DiagnosticEventInstrumentation, WebTrackingInstrumentation, TraceInstrumentation) and their performance impacts, showing ~15% slower page response time for Low mode and significant degradation in High mode when throughput reaches 18MB/s. Recommendations for tuning High mode include selectively targeting few modules and modifying maximum log file size, with examples of collection plan modifications.
More from the IntelliTrace Stand-Alone Collector Configuration trail
- Searching and filtering the Events tab of the Diagnostic Tools window
- IntelliTrace, method call information, and Edit and Continue
- Finding swallowed and async exceptions using IntelliTrace in VS2015
- Collect data from a windows service using the IntelliTrace Standalone Collector
- IntelliTrace in Visual Studio Enterprise 2015 now supports attach!