Performance Details in IntelliTrace
Sep 20, 2013Larry Guger
Summary
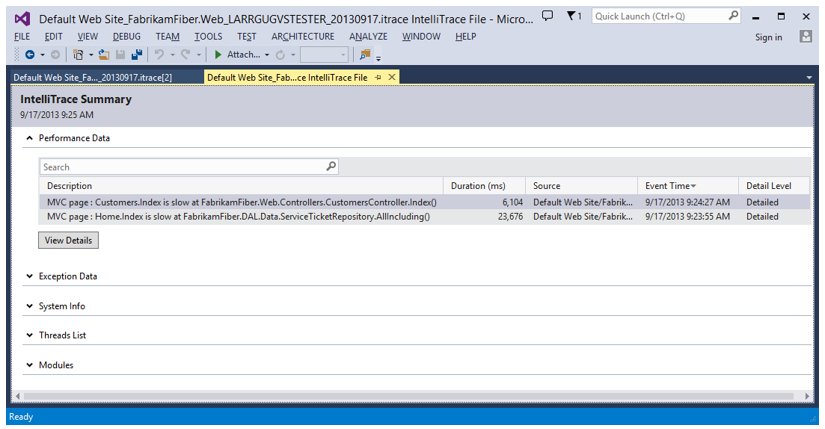
This post details the 'Performance Data' section on the IntelliTrace summary page, listing recorded performance violation events with fields like Description, Duration, Source, Event Time, and Detail Level. It also describes the 'Details Page' for performance events, including sections for 'Details' (collapsed by default), 'Slowest Calls' (up to 5), and the 'Execution Tree' of recorded calls. The post highlights the ability to 'Debug this event' by selecting relevant calls within the execution tree and resolving to source code if symbol and source files are available.
More from the IntelliTrace Stand-Alone Collector Configuration trail
- Searching and filtering the Events tab of the Diagnostic Tools window
- IntelliTrace, method call information, and Edit and Continue
- Finding swallowed and async exceptions using IntelliTrace in VS2015
- Collect data from a windows service using the IntelliTrace Standalone Collector
- IntelliTrace in Visual Studio Enterprise 2015 now supports attach!