UI Enhancements for IntelliTrace with Visual Studio 2013 Update 2
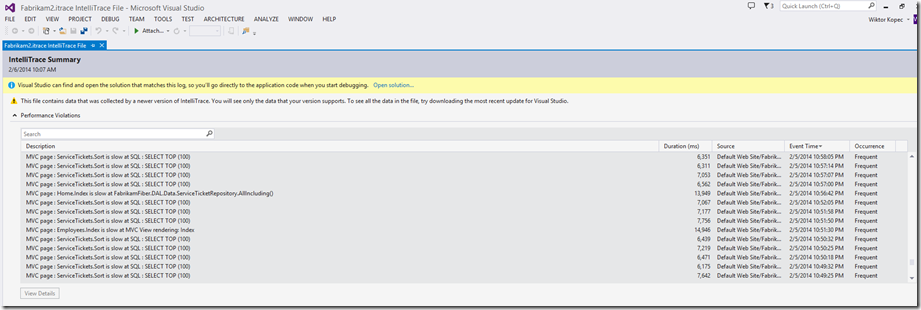
This post introduces two UI enhancements for IntelliTrace when analyzing performance events sourced from the Microsoft Monitoring Agent (MMA) in Visual Studio 2013 Update 2: 1. Performance Event Grouping: Redundant performance events with the same description are now combined, displaying average and max durations. This reduces noise and makes it easier to identify recurring performance violations. Users can uncheck 'Group by Description' to revert to the previous RTM experience. 2. Performance Details Hot Path: The performance details page now visualizes the 'hot path' for the slowest calls, indicating the methods that led up to a slow call using flame icons. This aids in understanding the code flow contributing to performance violations, particularly in complex call trees. The post also mentions specific analysis for slow SQL calls and directs readers to another blog post for details.
More from the IntelliTrace Stand-Alone Collector Configuration trail
- Searching and filtering the Events tab of the Diagnostic Tools window
- IntelliTrace, method call information, and Edit and Continue
- Finding swallowed and async exceptions using IntelliTrace in VS2015
- Collect data from a windows service using the IntelliTrace Standalone Collector
- IntelliTrace in Visual Studio Enterprise 2015 now supports attach!