Walkthrough of Live Debugging using IntelliTrace in Visual Studio 2015 (Text Editor)
Jan 16, 2015Angelos Petropoulos
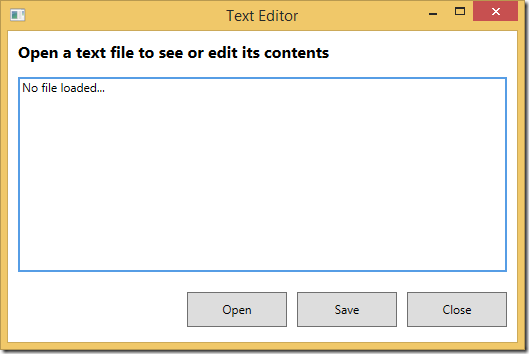
Summary
This post provides a detailed walkthrough of using IntelliTrace in Visual Studio 2015 to debug a specific bug in a WPF text editor application. It demonstrates how IntelliTrace's historical debugging capabilities, specifically by capturing File and Gesture events, helped identify an unexpected file reload mechanism triggered by `ReadFile` when saving a file. The post highlights how IntelliTrace saved debugging time by avoiding manual breakpoint setting and iterative testing, allowing the developer to pinpoint the root cause in the `OnFileChanged` method.
More from the IntelliTrace Stand-Alone Collector Configuration trail
- Searching and filtering the Events tab of the Diagnostic Tools window
- IntelliTrace, method call information, and Edit and Continue
- Finding swallowed and async exceptions using IntelliTrace in VS2015
- Collect data from a windows service using the IntelliTrace Standalone Collector
- IntelliTrace in Visual Studio Enterprise 2015 now supports attach!