Debugging .NET Native Windows Universal Apps
Jul 29, 2015Andrew B Hall - MSFT
Summary
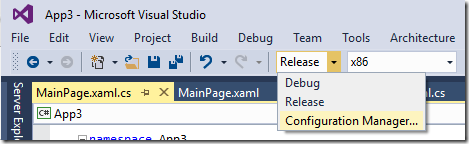
This post details debugging .NET Native Windows Universal Apps. It explains that the default Debug configuration uses the .NET Core runtime for fast iteration, but Release builds use the .NET Native tool chain for production. To debug .NET Native specific issues, it recommends disabling code optimizations by creating a new build configuration. It also highlights differences in inspecting runtime types, specifically the '[Native Implementation]' node for Windows Runtime objects, and the need to load symbols from Microsoft Public Symbol servers.
More from the .NET Memory Analysis in Production trail
- Diagnosing Event Handler Leaks with the Memory Usage Tool in Visual Studio 2015
- Memory Usage Tool while debugging in Visual Studio 2015
- .NET Memory Analysis: Go to Source in Visual Studio 2013 Update 3
- Diagnosing memory issues with the new Memory Usage Tool in Visual Studio
- .NET Memory Analysis: Object Inspection