.NET Memory Analysis: Object Inspection
Feb 6, 2014Andrew Chan - MSFT
Summary
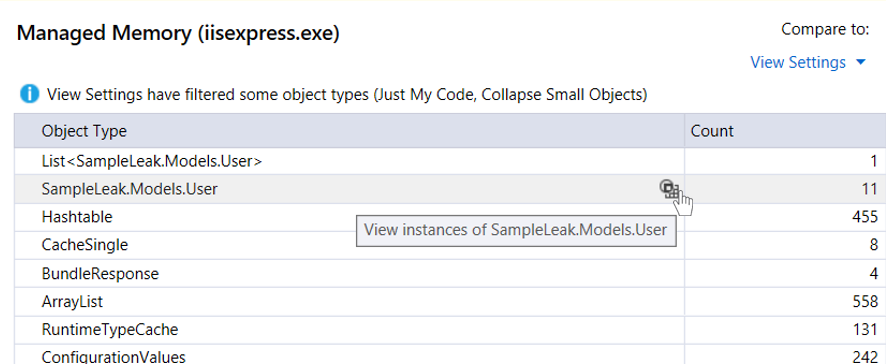
Introduced a new feature in Visual Studio 2013 Update 2 to inspect values of objects and instances within .NET memory dumps. This includes an 'Instance View' accessible from the type summary page, allowing for deeper inspection of dump data. Developers can edit default values shown by adding a DebuggerDisplayAttribute to their code. Hovering over items reveals DataTips for inspecting values, and objects can be expanded to inspect subfields. The feature also applies to the 'Paths to Root' and 'Referenced Objects' graphs. Navigation back to the type overview is available via breadcrumbs or the back button/backspace key.
More from the .NET Memory Analysis in Production trail
- Debugging .NET Native Windows Universal Apps
- Diagnosing Event Handler Leaks with the Memory Usage Tool in Visual Studio 2015
- Memory Usage Tool while debugging in Visual Studio 2015
- .NET Memory Analysis: Go to Source in Visual Studio 2013 Update 3
- Diagnosing memory issues with the new Memory Usage Tool in Visual Studio