Memory Usage Tool while debugging in Visual Studio 2015
Nov 13, 2014Charles Willis (MSFT)
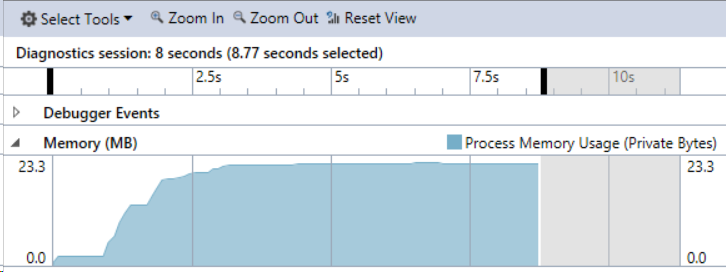
Summary
Introduces a new Memory Usage tool integrated with the debugger in Visual Studio 2015. This tool allows for real-time memory profiling while debugging, offering a live graph of Private Bytes, simplified mode selection (managed, native, or both) based on the debugger type, improved mixed-mode snapshots showing both managed and native heap summaries, and a familiar heap analysis view. It builds upon the post-mortem Memory Usage tool from Visual Studio 2013 by enabling interactive debugging control during performance investigations.