Get insights into your team’s health with Azure Boards Reports
Aug 7, 2019Romi Koifman
Summary
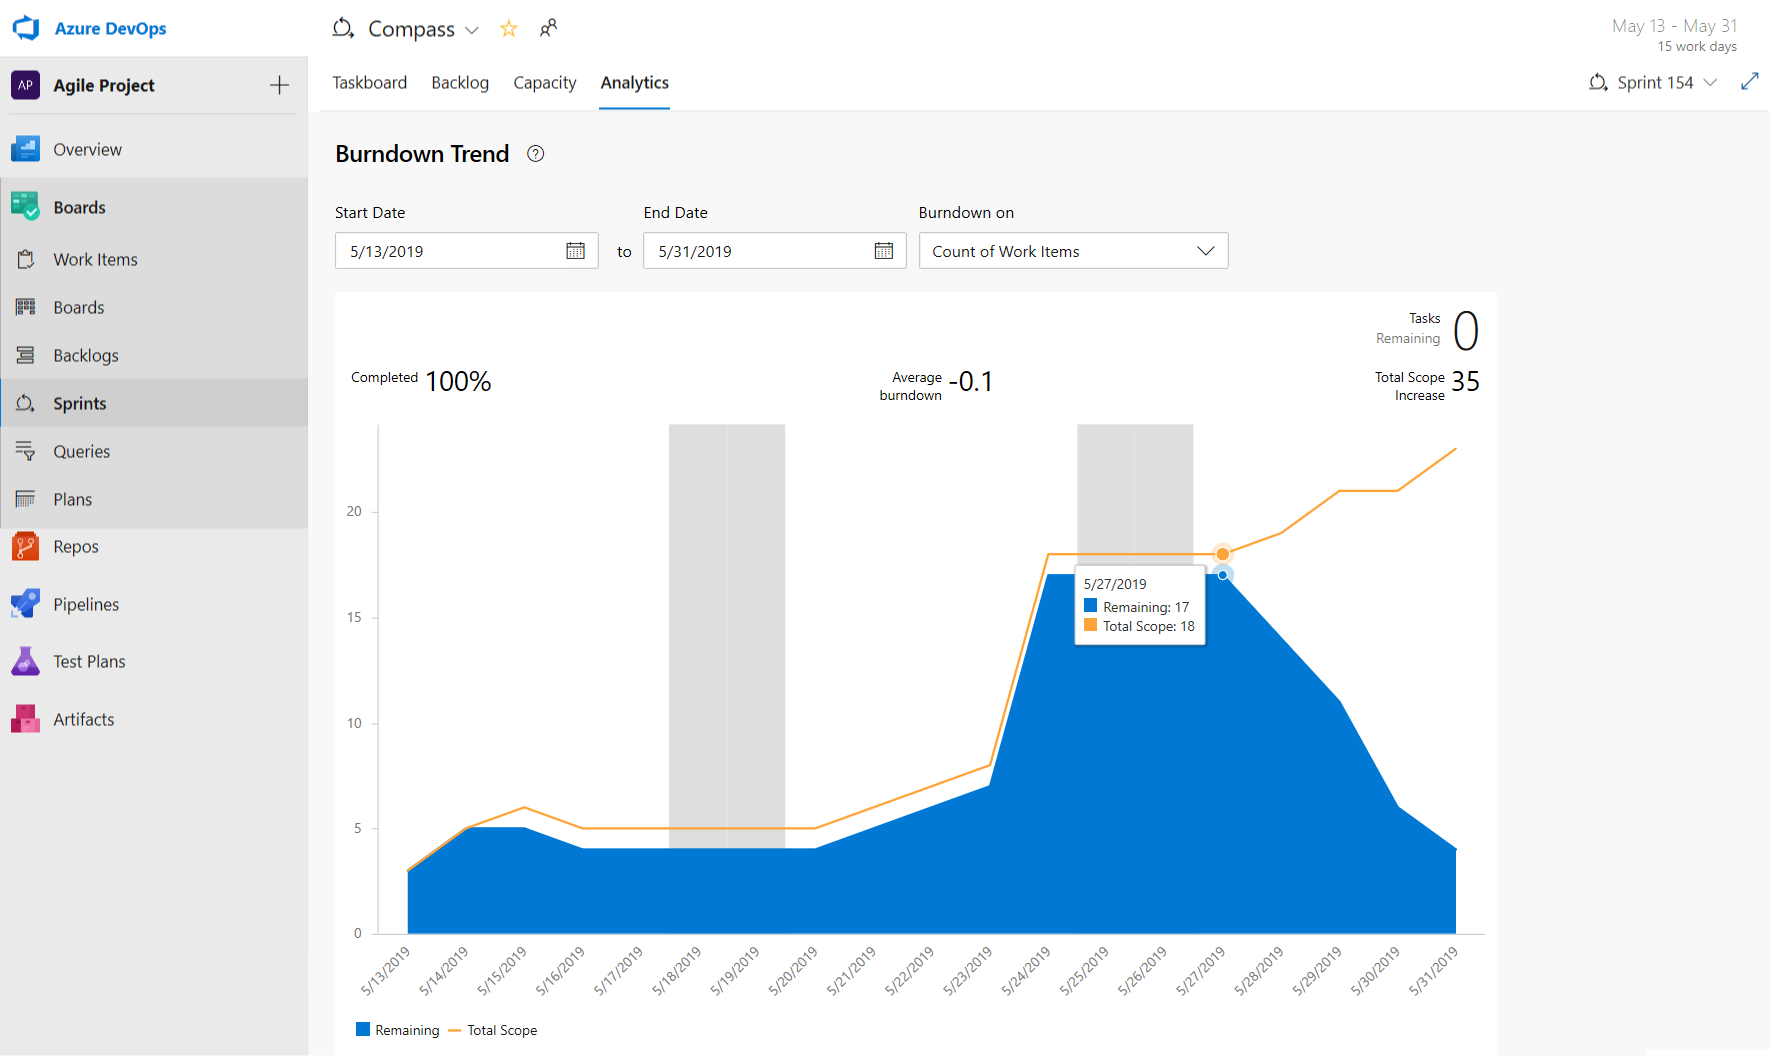
This post introduces three new interactive reports in Azure Boards: Sprint Burndown, Cumulative Flow Diagram (CFD), and Velocity. The Sprint Burndown report is enhanced with additional metrics (percentage completed, average burndown, total scope line), flexible date options, and support for counting work items or other numeric fields. The Velocity report is improved to monitor all backlog levels and configure metrics like sum of story points. The CFD report provides enhanced control over time periods, board columns, and swimlines, with a focus on WIP and workflow trends. These reports replace older versions and offer interactive features for data exploration.