Investigating Memory Leaks in Azure Web Sites with Visual Studio 2013
Dec 20, 2013Steve Carroll msft
Summary
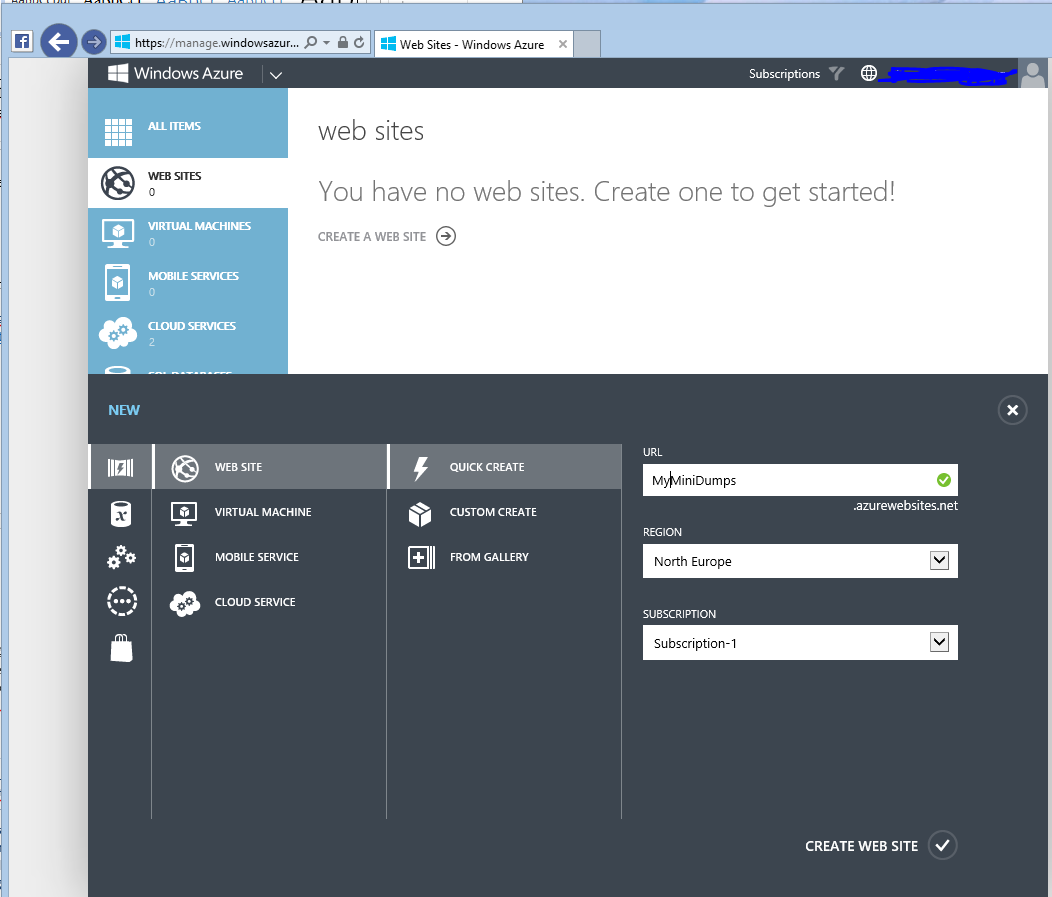
This post details a scenario for investigating memory leaks in production Azure Web Sites using Visual Studio 2013. It covers setting up an Azure Web Site with Git deployment, obtaining deployment credentials, and then using PowerShell to call Diagnostics REST APIs to retrieve GCDump files. The post provides specific PowerShell commands and URIs for invoking the diagnostics/processes/0/gcdump endpoint. It also explains how to open the resulting .diagsession file in Visual Studio to analyze the managed heap and identify objects that are being kept alive. An update is mentioned that allows for comparing two diagsession files to more easily identify leaks.
More from the .NET Memory Analysis in Production trail
- Debugging .NET Native Windows Universal Apps
- Diagnosing Event Handler Leaks with the Memory Usage Tool in Visual Studio 2015
- Memory Usage Tool while debugging in Visual Studio 2015
- .NET Memory Analysis: Go to Source in Visual Studio 2013 Update 3
- Diagnosing memory issues with the new Memory Usage Tool in Visual Studio