Seeing function return values in the Visual Studio 2013 debugger
Jun 27, 2013YanivF
Summary
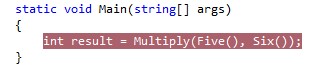
Introduced the ability to see function return values in the Visual Studio 2013 debugger for .NET code. This feature allows developers to examine the return value of a function when stepping over or out of it, particularly useful when the returned value is not stored in a local variable. The return values are displayed in the 'Autos Window' and can be accessed using the pseudo-variable '$ReturnValue' in the Watch and Immediate windows. The post provides a C# console application example to demonstrate this functionality.
More from the .NET Memory Analysis in Production trail
- Debugging .NET Native Windows Universal Apps
- Diagnosing Event Handler Leaks with the Memory Usage Tool in Visual Studio 2015
- Memory Usage Tool while debugging in Visual Studio 2015
- .NET Memory Analysis: Go to Source in Visual Studio 2013 Update 3
- Diagnosing memory issues with the new Memory Usage Tool in Visual Studio