Using Visual Studio 2013 to Diagnose .NET Memory Issues in Production
Jun 21, 2013Andrew B Hall - MSFT
Summary
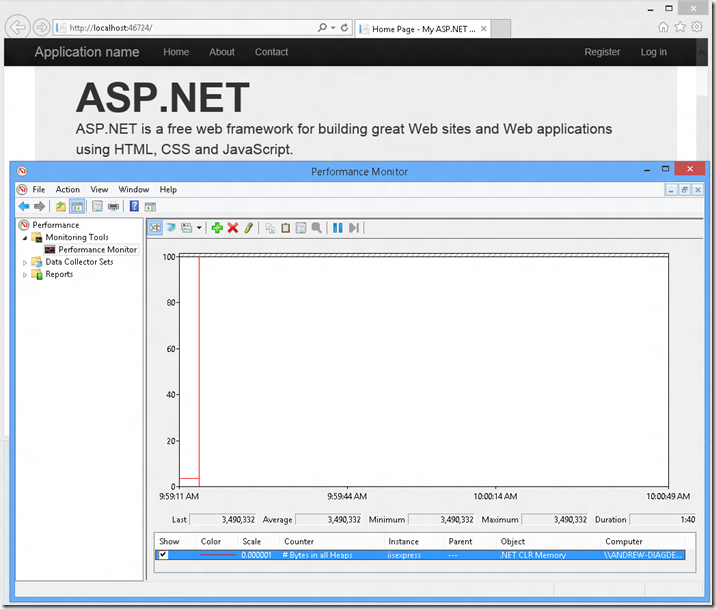
This post details the introduction of a new feature in Visual Studio 2013 for diagnosing .NET memory issues in production using .dmp files. It explains common memory problems (leaks, inefficient use, unnecessary allocations) and their symptoms (crashes, poor performance). The post provides a step-by-step example of collecting data using Performance Monitor and ProcDump, and then analyzing the .dmp file in Visual Studio 2013's managed memory analysis view. It demonstrates how to identify objects consuming the most memory and their references, and how to improve memory efficiency by modifying database queries to retrieve only necessary data. It also introduces the comparison of dump files to identify memory leaks.
More from the .NET Memory Analysis in Production trail
- Debugging .NET Native Windows Universal Apps
- Diagnosing Event Handler Leaks with the Memory Usage Tool in Visual Studio 2015
- Memory Usage Tool while debugging in Visual Studio 2015
- .NET Memory Analysis: Go to Source in Visual Studio 2013 Update 3
- Diagnosing memory issues with the new Memory Usage Tool in Visual Studio